Intro
The base idea behind this post is my desire to know how random USAU nationals are. Some sports leagues have a huge amount of variance in their postseason (NCAA's March madness) and some sports leagues have a lot less variance (the NBA playoffs). It's unclear where USAU nationals stands on this spectrum of volatility. This is also a particularly difficult problem to consider subjectively, since there is so much hindsight bias after the fact. After Brute Squad won this year (2023), for example, it's easy to look back on their season, read the signs of their impending success, and feel that it was inevitable all along - but it would have felt just as inevitable if Scandal had won.
There are a few different ways to approach this question. There's not a singular agreed-upon way to measure variance in sport (a couple of efforts: [1] [2]) but a fun and interesting one is by simulating the tournament.
Simulating nationals
One very nice advantage of USA's ranking algorithm is that we have Elo rankings for each team, from which we can directly obtain the expected chance that any given team will beat any other given team in a single game. The formula for this is \( P(A) = \frac{1}{1 + 10^{\frac{elo_B - elo_A}{400}}} \) . This makes simulating nationals straightforward: all we need to do is encode the format of the tournament and then we can randomly pick winners based on the Elo rankings for each matchup. We'll simulate the tournament 100,000 times for each division. In our approach, we won't update a team's Elo after a game, which we ideally should.
Results
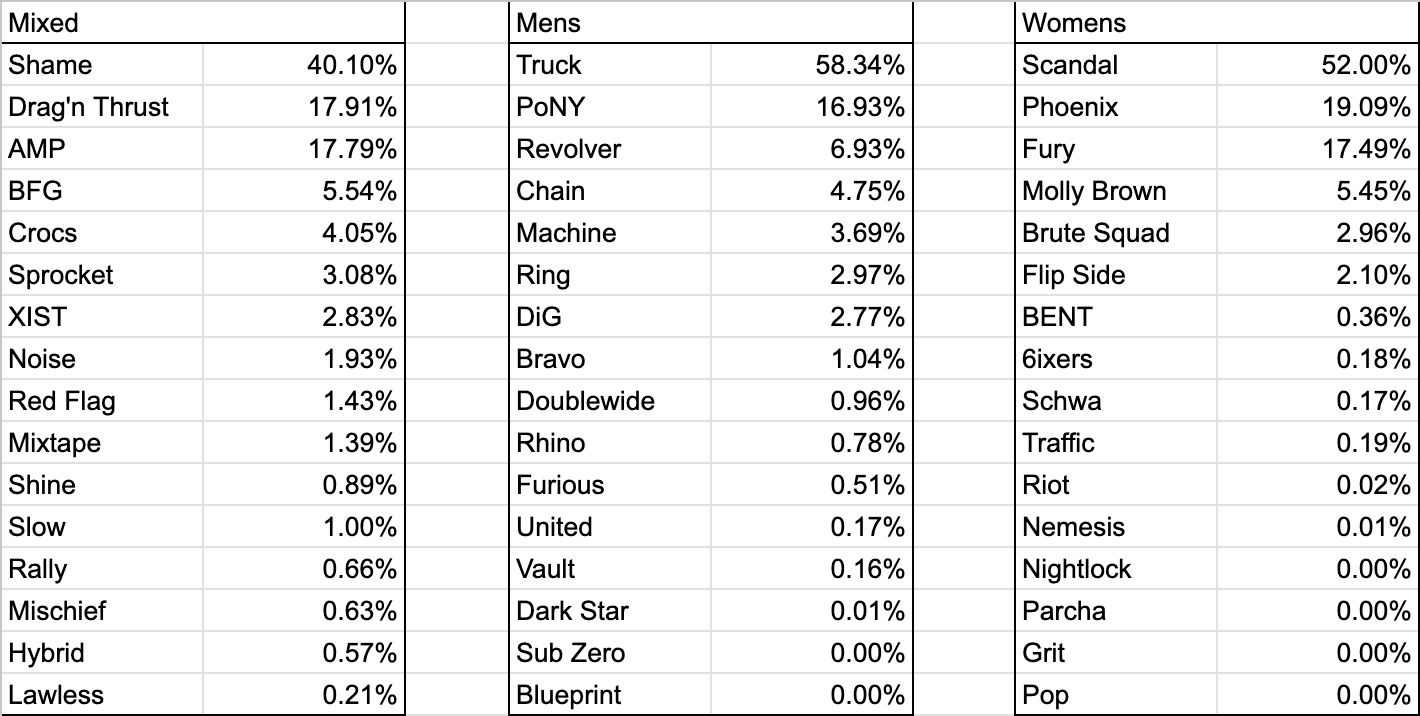
Here's the simulated win percentages for each team at 2023 club nationals.

I see a few takeaways:
- The mixed division has the greatest distribution of potential winners, which matches up with the famous unpredictability of mixed nationals.
- The women's division is the most stratified. The last-ranked team in mixed has a greater chance of winning the tournament than the eighth ranked women's team!
- 4 women's teams and 2 men's teams never won the tournament 100,000 simulations. This is surprising to me - I expected every team to have at least some chance.
- In this model, pool composition does not much matter. There are only two instances of a lower-Elo team (Traffic; Slow) having a higher chance of winning than a higher-Elo team due to a favorable pool and bracket path, and in both cases they have almost the same Elo ranking as the teams they leapfrog.
Conclusion
There's a lot more to be done with this framework. I'd like to dig into trends over time, find historically unlikely runs (and upsets), calculate the likelihood of a team making a certain round, and more. I think my ideal output would be a webapp that is released pre-nationals that gives live likelihoods of the nationals and that updates during nationals, like NCAA march madness brackets.
